Tracking Trends in Population Health Over Time
This feature was originally published on the IP3 Blog and is being reproduced for Community Commons with permission of the Institute for People, Place, and Possibility.
Tracking Trends in Population Health Over Time
Population health data helps us account for local conditions, instead of generalizing or making assumptions about what is needed, and prioritize strategies for community improvement. We often look at a recent “snapshot” of community data, or data from a single point in time; however, additional insights can be gleaned with multiple years of data. Examining population health measures over time—so-called “time series data”—paints a clearer picture of community health and its upstream factors by providing temporal context and demonstrating how conditions may be shifting. This added context illuminates where we might focus efforts and helps changemakers prioritize investments.
Trend-Spotting
Time series data can shed light on important trends. For example, opioid overdose death rates in a community may be in line with state and national benchmarks; however, upon further investigation with time series data, we find that opioid overdose death rates have steadily increased over the years. From the data, we see that there is a growing health concern upon which we may want to focus our efforts to prevent problem opioid use and overdose. Exploring multiple years of data and observing changes over time tells us whether a community is building, maintaining, or losing momentum with regard to specific population health indicators and categories.
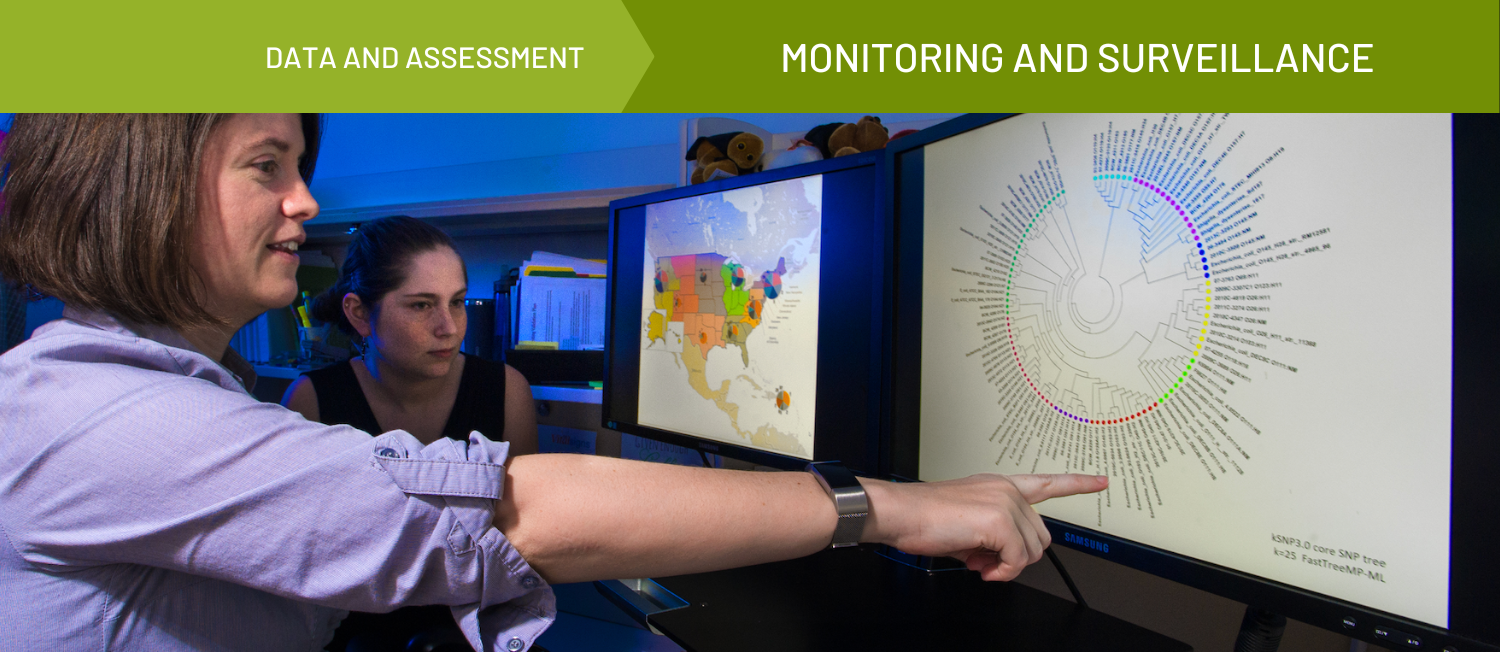
Public Health Surveillance
Consistently examining time-series data is a type of public health surveillance, a core component of the field of public health defined as the ongoing, systematic collection, analysis, and interpretation of health-related data essential to planning, implementation, and evaluation of public health practice, closely integrated with the timely dissemination of these data to those responsible for prevention and control. Data collected and made available through public health surveillance can be used for health action by public health personnel, government leaders, and the public to guide public health policy and programs. Among other uses, public health surveillance does the following, which require time-series data:
Detect epidemics, health problems, changes in health behaviors
Monitor changes in infectious and environmental agents
Assess the effectiveness of programs and control measures
Reliable and Valid Tracking Data
Our ability to track trends over time is limited by the data at our disposal. It’s important to use reliable time-series data from trusted sources that have consistent measurement approaches year over year. When data collection methods change, time series data may not be reliable because the indicator is not measured in the same way across years. When data measurement methods are not consistent, it is not valid to make comparisons across years. Multiple sources may measure the same condition or outcome–for example, the American Community Survey and Bureau of Labor Statistics both measure unemployment but employ significantly different methods. It is not valid to make comparisons across years when using different sources.

Finding Context in the Trends
It’s important to keep in mind that time-series data can obscure or distort important community dynamics. Thus, it is wise to dig deeper into the data and ground truth. One example of this phenomenon is illustrated by looking at unemployment rates. Coming out of a recession, we may observe that unemployment rates in some places rebound more quickly than expected—a positive change! However, this may have less to do with increased job opportunities and more to do with decreased labor force participation. Labor force participation decreases when people exit the workforce due to retirement, disability or other reasons. Persons out of the labor force are not counted in unemployment statistics.
In another example, we may observe median household income increasing year-to-year. On its face, this looks like rising prosperity for residents, but we may be failing to account for changes in residential mobility. Lower-income households may be getting priced out of the community and relocating where housing costs are cheaper, resulting in fewer lower-income households and a higher median household income. It must also be stated that while we may observe population-level improvements across multiple years, not all groups within a population may experience improvements. In fact, disparities between demographic groups could be increasing.
Linking Trends and Interventions
Although an improvement (positive change) in secondary data cannot be used to evaluate a specific community program (correlation is not the same as causation), it can be useful to track relevant trends over time as a program is implemented. For example, if a community coalition is implementing programming to prevent and decrease impaired driving in the region, one might want to track alcohol-impaired driving deaths to see if they decline over the course of the program. If alcohol-impaired driving deaths do decline, we cannot say with confidence that the improvement was a result of the coalition’s programming. Nevertheless, tracking trends provides helpful, relevant context about impaired driving in the community and may be especially valuable when a (time-consuming and costly) comprehensive program evaluation is not feasible.


Related Topics