Many factors play a role in a child’s educational success, and it is the mission of the U.S. Department of Education to promote excellence in education and ensure equal access. To help achieve this goal, the Department of Education plans to provide over $15 billion in federal funds to qualifying Title I school districts for the next school year. These funds will improve the academic achievement of children living in poverty. To identify school districts with children in poverty, the Department of Education partners with the U.S. Census Bureau’s Small Area Income and Poverty Estimates (SAIPE) program. The SAIPE program produces the only source of single-year statistics of childhood poverty for the nation’s more than 13,000 public school districts.

To estimate the number of children living in poverty within a school district, the SAIPE program pays special attention to school district boundary changes. Today’s release of the 2015 SAIPE reflects the most recent school district boundary update.
In the latest update, for 2015 and 2016, there are 13,245 U.S. public school districts. This is down from 13,486 school districts from the previous update for 2013 and 2014, a decrease of 241 school districts. Changes are typically the result of school districts shifting, splitting or consolidating boundaries, often driven by state or local policy changes.

Figure 1 shows a hypothetical secondary (often grades 9-12) school district (Sec. D) that covers the same geographical boundaries as three distinct elementary (often
grades K-8) school districts (Elem. A, Elem. B, and Elem. C). As they stand in the figure, each school district would be financially responsible to provide services to school-aged children within their district’s grade range. For these four hypothetical school districts, the Department of Education would use SAIPE along with other data sources to determine Title I eligibility and funding allocations.
We often see elementary and secondary school districts (like those in Figure 1) consolidated into one unified school district. In the latest boundary update, this type of consolidation occurred throughout Vermont as well as other states. Additionally, many neighboring unified school districts consolidated to form larger entities. Figure 2 displays a side-by-side comparison of the unified and elementary school district boundaries in Vermont before and after the latest boundary update. Before the latest boundary update, Vermont had 276 school districts. Now Vermont has only 60 school districts.
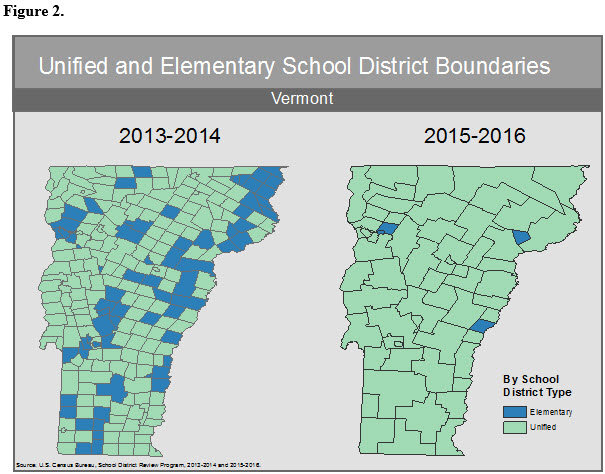
Figure 2 illustrates the kind of widespread boundary changes that can occur after a school district boundary update. When a school district boundary changes, there is a change in the number of school-aged children living in the district, including children who are living in poverty. Capturing the latest school district boundary changes is crucial for the SAIPE program to produce timely and accurate estimates of childhood poverty.
Given the SAIPE data’s timeliness and adaptability, we can examine how childhood poverty in school districts changes over time. To illustrate these changes, the recent SAIPE data release includes an animated map displaying data from 2007 through 2015. The year 2007 serves as a base year before the most recent recession. In the animated map, the lighter colors represent lower poverty rates, and the darker colors represent higher poverty rates. The animation allows us to see the changes in childhood poverty before, during and after the recession.
Figure 4 focuses on school districts with high poverty (at or above 20.0 percent). This figure displays annual SAIPE data back through 1999 and constructs a fuller picture of pre- and post-recession trends for school districts with high poverty. Since the most recent recession, there has been an increase in the percentage of school districts with high poverty. Since 2013, we are only just beginning to see that percentage decrease. 
As the composition of childhood poverty changes over time, it is necessary for the Department of Education to identify all Title I qualifying districts and distribute funding where it is needed most. This work by the School District Review and SAIPE programs are two of many examples of how agencies work together to meet administrative needs for delivering resources, while ensuring the quality and accuracy of the information available to all stakeholders.